
R&D spending in Canada – increasing, but much more is needed, especially by private sector

 Peter Josty is Executive Director of the Centre for Innovation Studies, based in Calgary.
There have been a slew of recent statistics on research and development in Canada. What’s going on?
Canada’s gross expenditures on R&D as a percentage of GDP (GERD) have trended down for more than 20 years, in contrast to other G7 countries that have trended up over the same period (see graphic below).
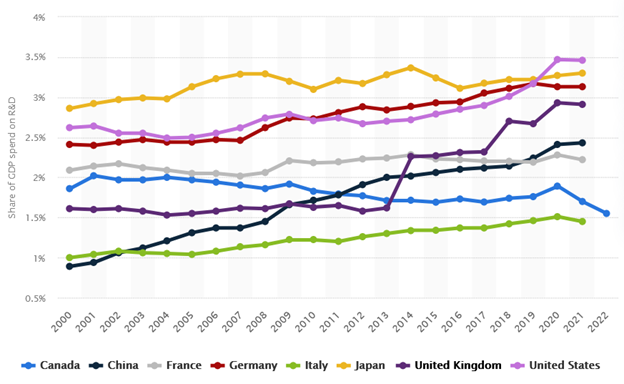
Source: Statista
GERD consists of two main parts – spending by companies (BERD) and spending by universities (HERD).
When it comes to BERD, Canadian businesses spent a record $30.4 billion on in-house R&D in 2022, an increase of 9.4 percent from 2021. That followed a record 17.3-percent increase from 2020 to 2021.
Preliminary data for 2023 indicated that in-house R&D spending will continue to rise but at a slower pace, with spending increasing by 3.4 percent (+$1.0 billion) to a projected $31.4 billion.
Based on preliminary spending intentions for 2024, in-house R&D spending is expected to increase by $1.5 billion (+4.8 percent) to $32.9 billion in 2024.
In addition to in-house R&D, Canadian companies spent another $5.8 billion on outsourced R&D in 2022, mostly to Canadian recipients.
How does Canada compare?
Canada had the second-lowest business expenditures on R&D as a percentage of GDP (BERD) in the G7 in 2022. The trend has been downward for more than 20 years, in contrast to the OECD average, which has trended upwards over that time period (see graphic below).
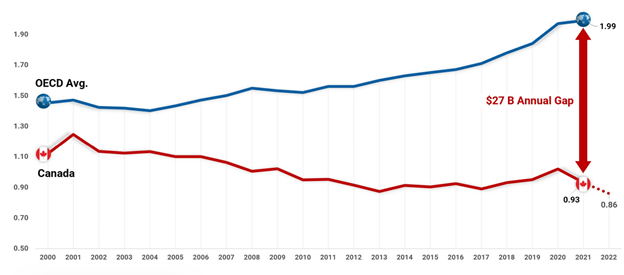
Source: Global Advantage Consulting
According to Statistics Canada, assets under foreign control in Canada were $2.5 trillion, 14.7 percent of total assets in 2022.
However, foreigners control one third of in-house R&D spending in Canada – $11.52 billion of the total $30.4 billion. So assets under foreign control are much more R&D-intensive than Canadian-owned assets.
Where is R&D carried out?
As you might expect, most R&D is carried out by companies in Ontario and Quebec, the major manufacturing centres with large populations, followed by British Columbia and Alberta (see graphic below).
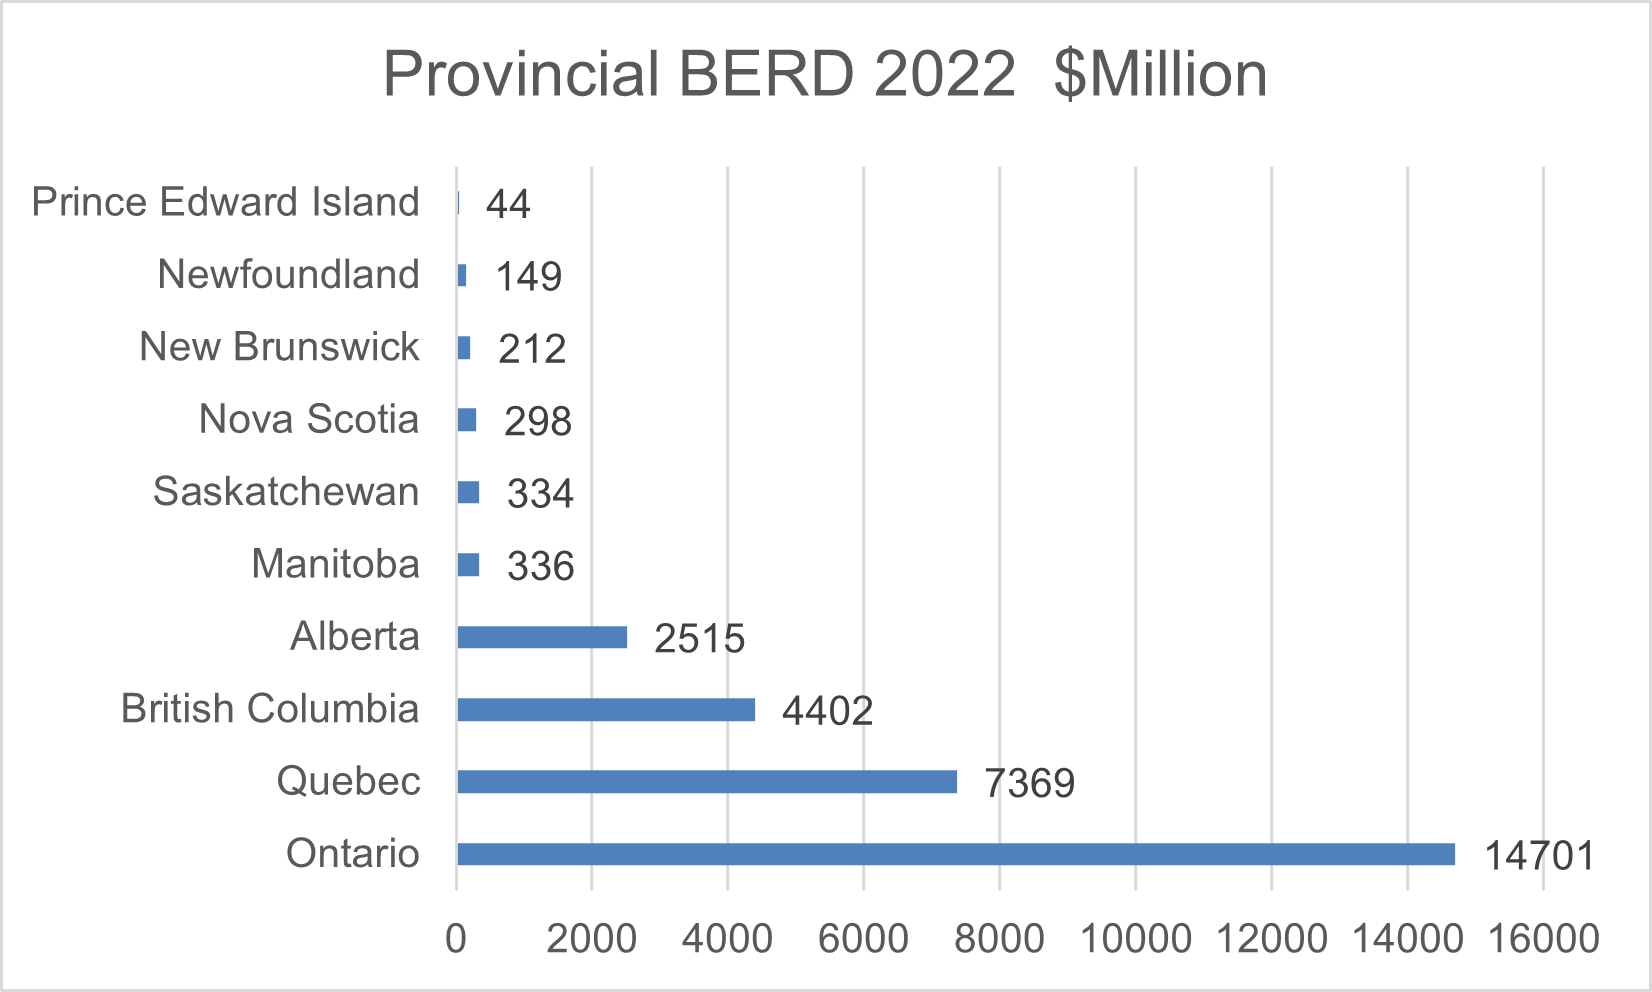
Source: Statistics Canada
Which companies spent most on R&D?
The table below shows information from Research Infosource for 2022. It is interesting to note that the top 10 companies spend almost exactly half the total BERD in Canada.
Rank | Company | R&D spending $000 | R&D as % of revenue |
1 | Shopify | $1,956,158 | 26.8 |
2 | Constellation software | $1,314,313 | 15.3 |
3 | Magna International | $844,544 | 1.7 |
4 | TELUS Corp. | $819,000 | 4.4 |
5 | AMD Canada | $698,819 | n/a |
6 | Bausch Health Company | $688,819 | 6.5 |
7 | BCE Inc. | $644.000 | 2.7 |
8 | Pratt and Whitney | $641,364 | n/a |
9 | Canadian Natural Resources Ltd. | $587,000 | 1.4 |
10 | Open Text Corp. | $573,155 | 12.6 |
Source: Research InfoSource
Why is BERD so low in Canada?
A part of the answer is that Canada has a resource-based economy and resource companies typically don’t spend much on R&D.
More broadly, Canada has relatively few companies in industries that typically spend more on R&D – technology hardware, software and internet, health industries and automotive and transportation.
Also, Canada has relatively few large companies and large companies spend more on R&D than small companies.
Finally, Canada has a very concentrated market in many sectors that are oligopolistic, so these sectors are less competitive and companies have less need to spend on R&D.
It is a sobering fact that the “Magnificent 7” companies (Alphabet, Amazon, Apple, Meta, Microsoft, Nvidia, and Tesla) together spent about US$200 billion on R&D in 2022, almost 10 time Canada’s total BERD. They need to spend that because they are in hyper-competitive markets.
The federal government’s Fall Economic Statement provided more generous support for R&D by increasing the funding for the Scientific Research and Experimental Development tax credit.
Higher Education R&D (HERD)
Higher education institutions spent $18.1 billion on R&D in 2022/23, up $1.4 billion (eight percent) from the year before. This is roughly 60 percent of BERD spending.
The field of natural sciences and engineering saw the largest gain as spending increased by $1.1 billion to $13.6 billion. Social sciences, humanities and the arts rose by $376 million to $4.5 billion.
The graph below from Statistics Canada shows a much more positive picture for HERD than for BERD. Canada is ranked second among the G7 for HERD in 2022, after being ranked first in 2020 and 2021 in terms of HERD spending as a percentage of GDP.
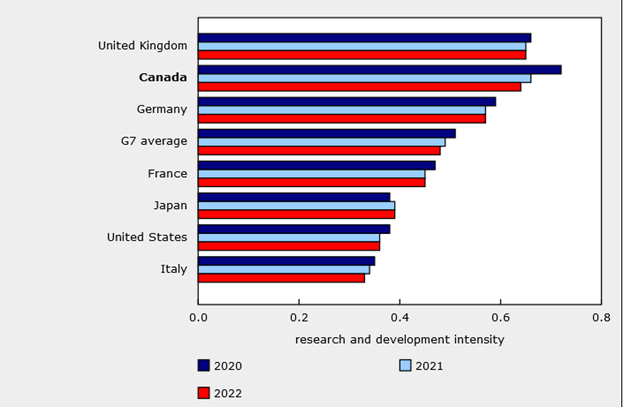
The Fall Economic Statement provided an additional $2.6 billion to the federal research granting councils over three years, so Canada’s good performance in HERD should continue.
Who paid for HERD spending?
As shown in the graph below, spending by the higher education institutions themselves has been rising over the last 10 years while other sources of funding have been fairly flat.
The 2024 federal budget increased tri-council funding (for the Natural Sciences and Engineering Research Council, the Social Sciences and Humanities Research Council and the Canadian Institutes of Health Research) by $1.8 billion over five years for core research funding.
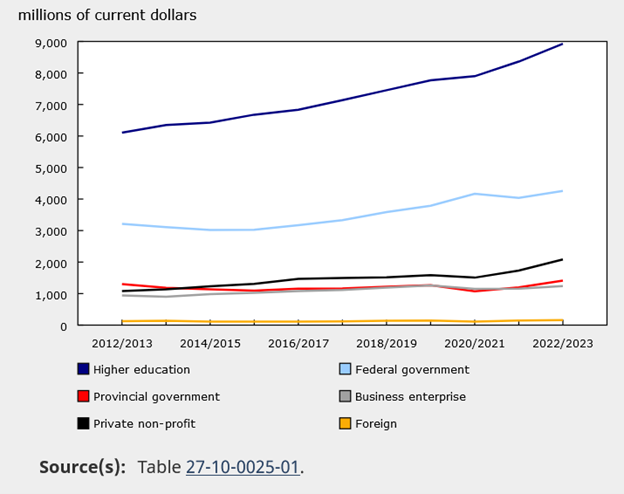
Source: Statistics Canada
The table below shows how Canadian universities ranked according to the three major ranking organizations, the Shanghai Academic Ranking of World Universities (ARWU), the Times Higher Education World University Rankings (THE), and the QS World University Rankings (WUR).
The top three Canadian universities in each ranking are the University of Toronto, the University of British Columbia and McGill University.
As higher education policy expert Alex Usher points out, we are a country with 0.5 percent of the world’s population and two percent of its GDP, and we also have by consensus about four percent of the world’s top 500 universities.
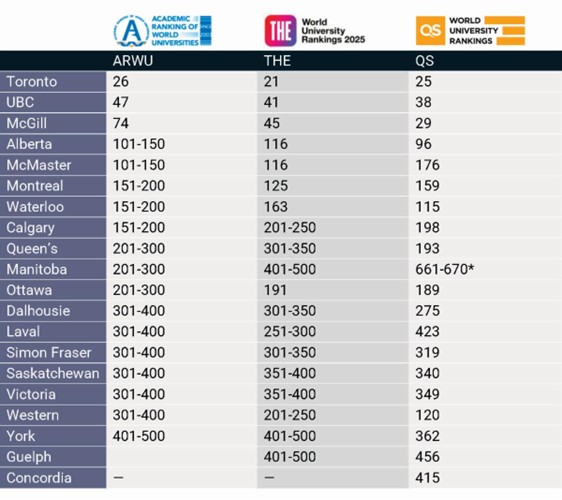
Source: Higher Education Strategy Associates, November 11, 2024
Conclusion
The declining trend in BERD over the last 20 years is concerning. BERD can be seen as an early indicator of future innovation and productivity improvement, as BERD often leads to new products and processes.
For Canada, which already has a big productivity problem, that does not bode well. More needs to be done to incentivize companies to spend on R&D to make the economy more competitive. Incentives in the Fall Economic Statement may possibly help with this.
HERD spending is useful up to a point, but it appears that the spillover to private companies is limited, and steps need to be taken to improve the transfer of R&D spending to the private sector.
R$
| Organizations: | |
| People: | |
| Topics: |


.jpg)
Events For Leaders in
Science, Tech, Innovation, and Policy
Discuss and learn from those in the know at our virtual and in-person events.
See Upcoming Events
You have 0 free articles remaining.
Don't miss out - start your free trial today.
Start your FREE trial Already a member? Log in
By using this website, you agree to our use of cookies. We use cookies to provide you with a great experience and to help our website run effectively in accordance with our Privacy Policy and Terms of Service.